An F-16C Fighting Falcon assigned to the 79th Fighter Squadron sits ready on the flightline at March Air Reserve Base, Calif., during Bamboo Eagle 24-1, Jan. 30, 2024. The exercise generated 95 mobility sorties and the movement of 662 passengers and 817,000 pounds of cargo. (U.S. Air Force photo by Senior Airman Steven Cardo)
Foreign Military Sales by Country
How much do European and Asian countries spend on defense equipment manufactured by American companies?
In 2023, the United States State Department announced that the total value of transferred defense articles and services and security cooperation activities conducted under the Foreign Military Sales system was $80.9 billion, the highest annual total of sales and assistance provided to our allies and partners. This trend of increased defense spending, paired with the presence of conflict and tension in the Middle East, Eastern Europe, and East Asia, requires the United States and its allies carefully track which countries are in possession of which weapons systems.
To illustrate the expenditures of European and Asian countries for US foreign military sales in 2022, each country’s 2022 foreign military sales is benchmarked against: its 2022 defense budget, to show how much of countries’ total defense budgets are paid to American manufacturers, and its gross national product, to determine which countries spend more or less than their economic profile would suggest.
Data Visualization
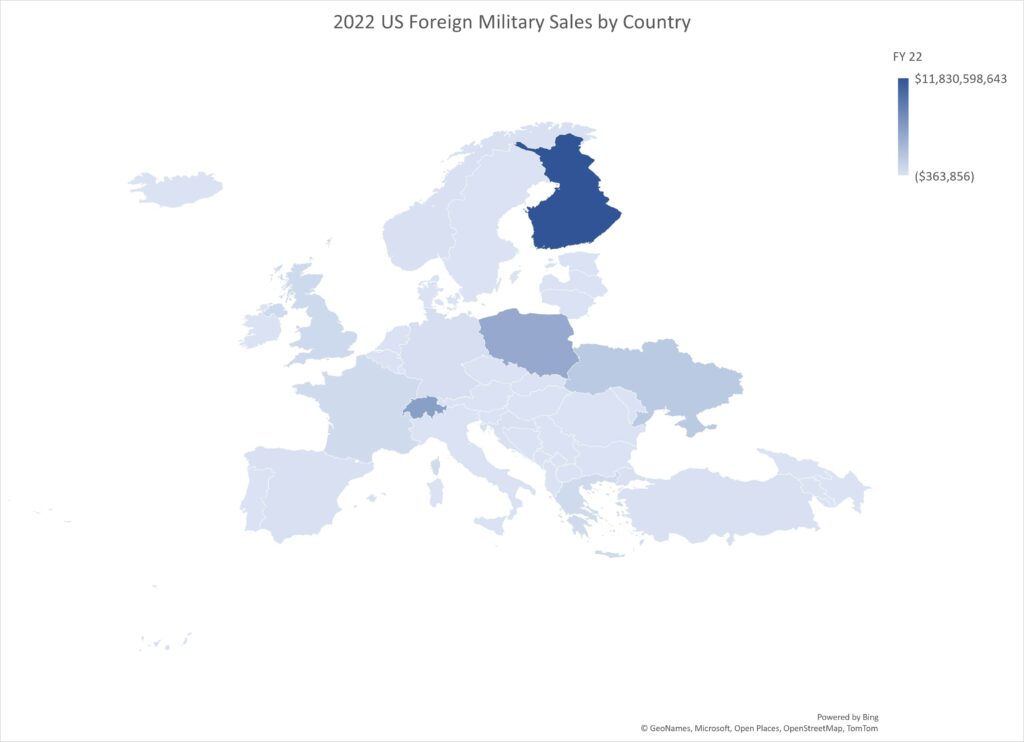
2022 Foreign Military Sales by Country, Region
Top Decile
Bottom Decile
Finland
$11,830,598,643
Albania
$(363,856)
Switzerland
$5,698,627,123
Bosnia-Herzegovina
$(303,258)
Poland
$4,825,771,663
Ireland
$0
Ukraine
$2,119,401,861
Serbia
$0
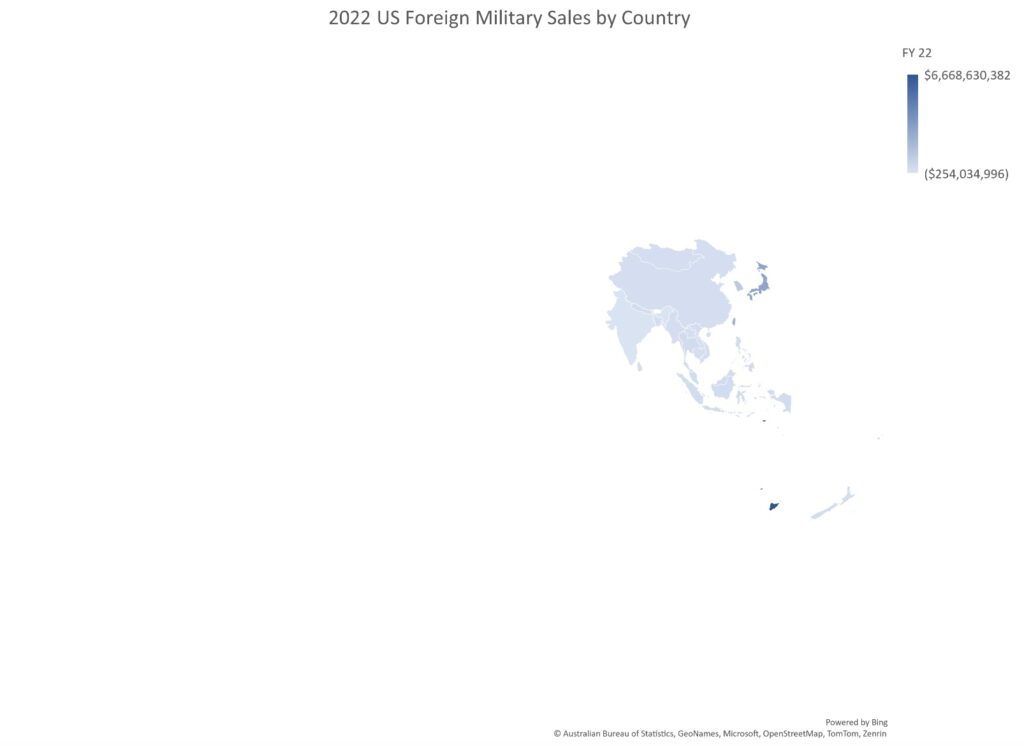
Top Decile
Bottom Decile
Australia
$6,668,630,382
India
$(254,034,996)
Japan
$2,803,481,408
Mongolia
$(801,486)
Taiwan
$2,057,121,797
Tonga
$(129,310)
South Korea
$947,261,920
Brunei
$0
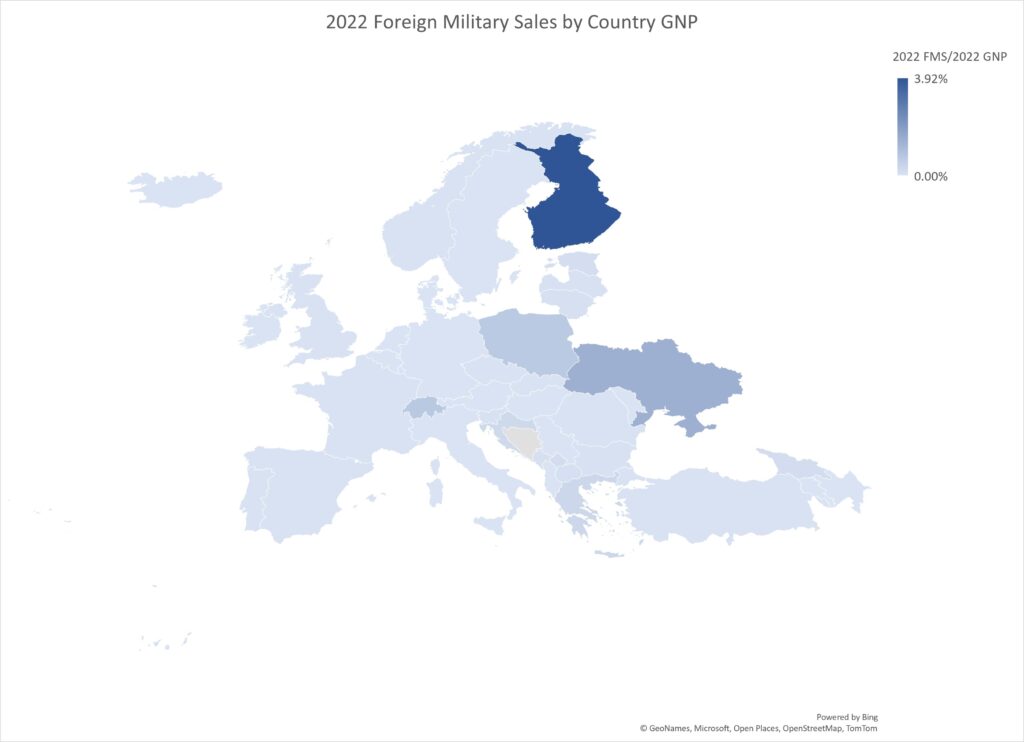
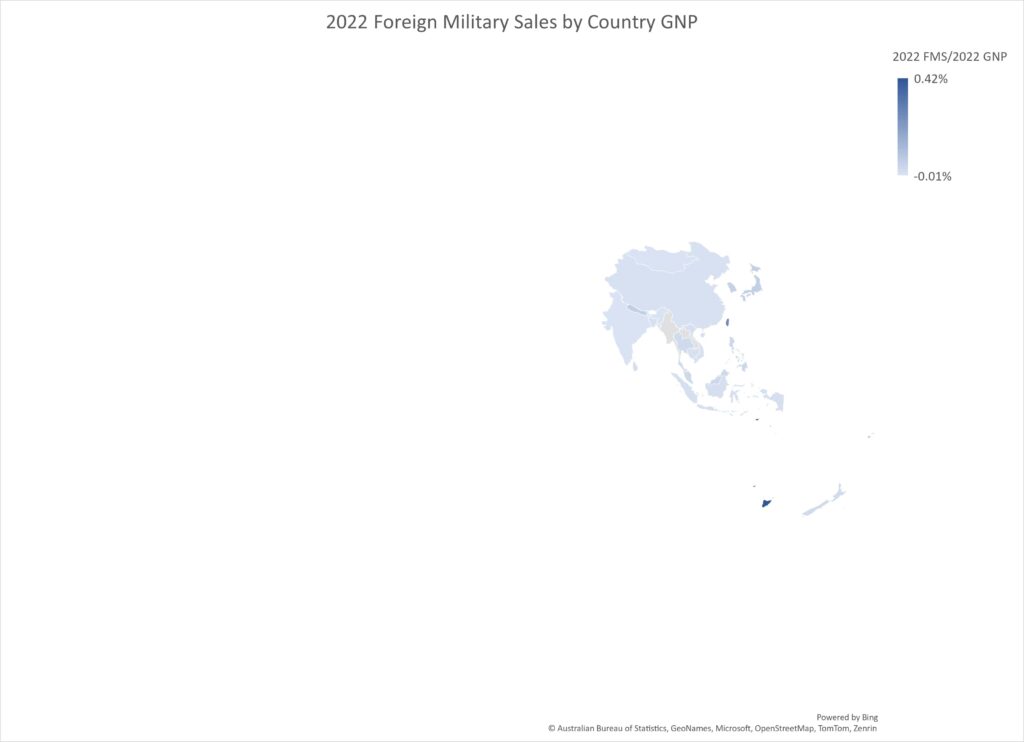
2022 Foreign Military Sales as Percent of GNP by Country, Region
Top Decile
Bottom Decile
Finland
245.30%
Bosnia-Herzegovina
(0.16)%
Switzerland
93.42%
Albania
(0.13)%
Poland
29.07%
Ireland
0.00%
Croatia
15.81%
Serbia
0.00%
Top Decile
Bottom Decile
Australia
0.4%
India
(0.3)%
Taiwan
0.3%
China
0%
Singapore
0.2%
Brunei
0%
Maldives
0.1%
Cambodia
0%
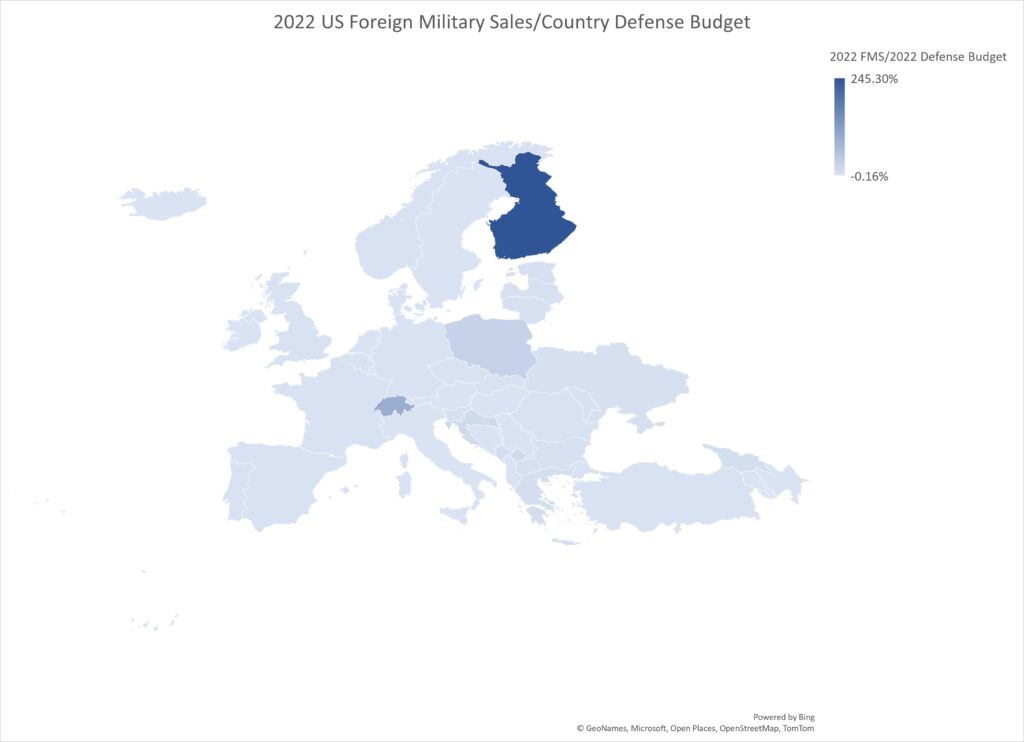
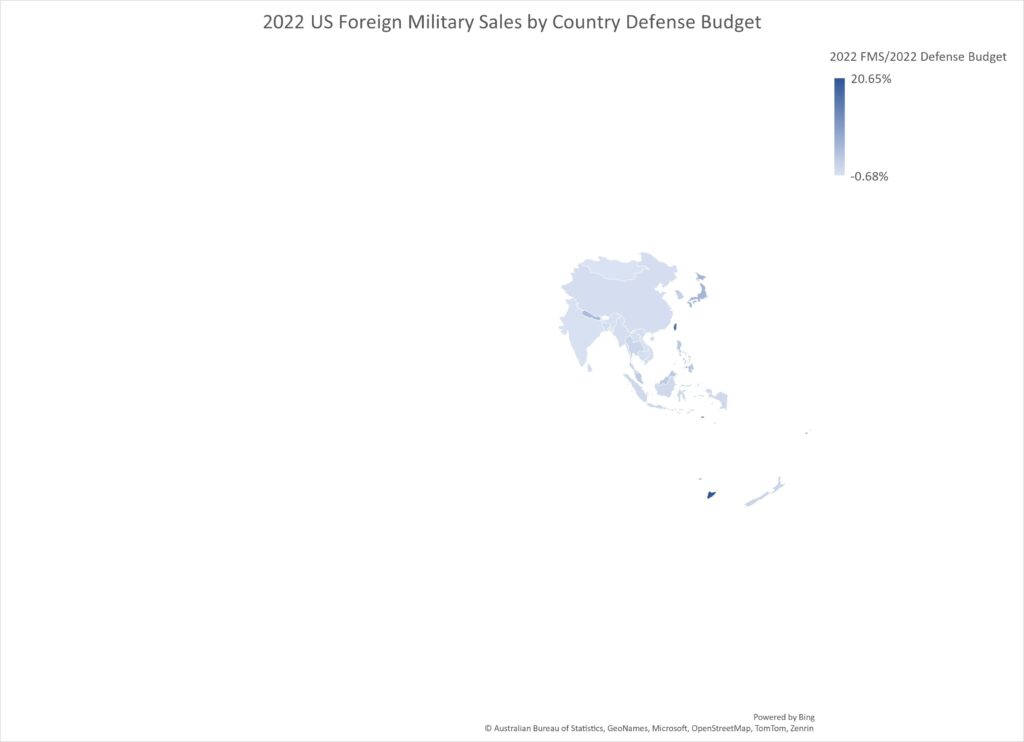
2022 Foreign Military Sales as Percent of Defense Budget by Country, Region
Top Decile
Bottom Decile
Finland
245.3%
Bosnia-Herzegovina
(0.2)%
Switzerland
93.4%
Albania
(0.1)%
Poland
29.1%
Azerbaijan
0%
Croatia
15.8%
Ireland
0%
Top Decile
Bottom Decile
Australia
20.6%
Mongolia
(0.7)%
Taiwan
16.5%
India
(0.3)%
Singapore
6.8%
Brunei
0%
Japan
6.1%
China
0%
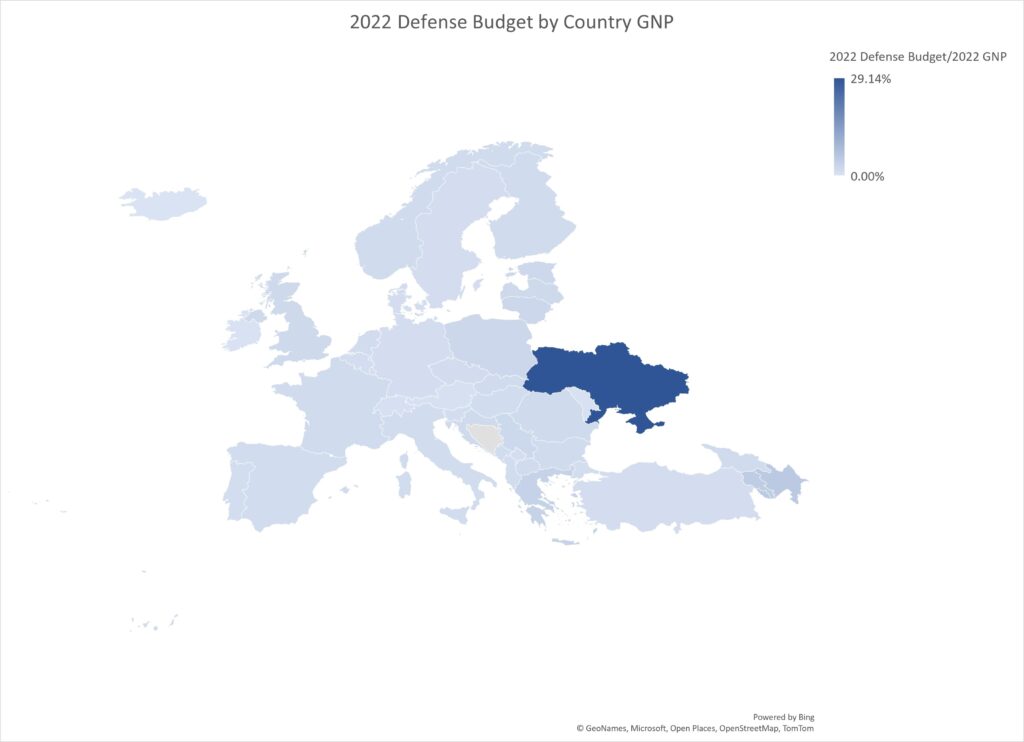
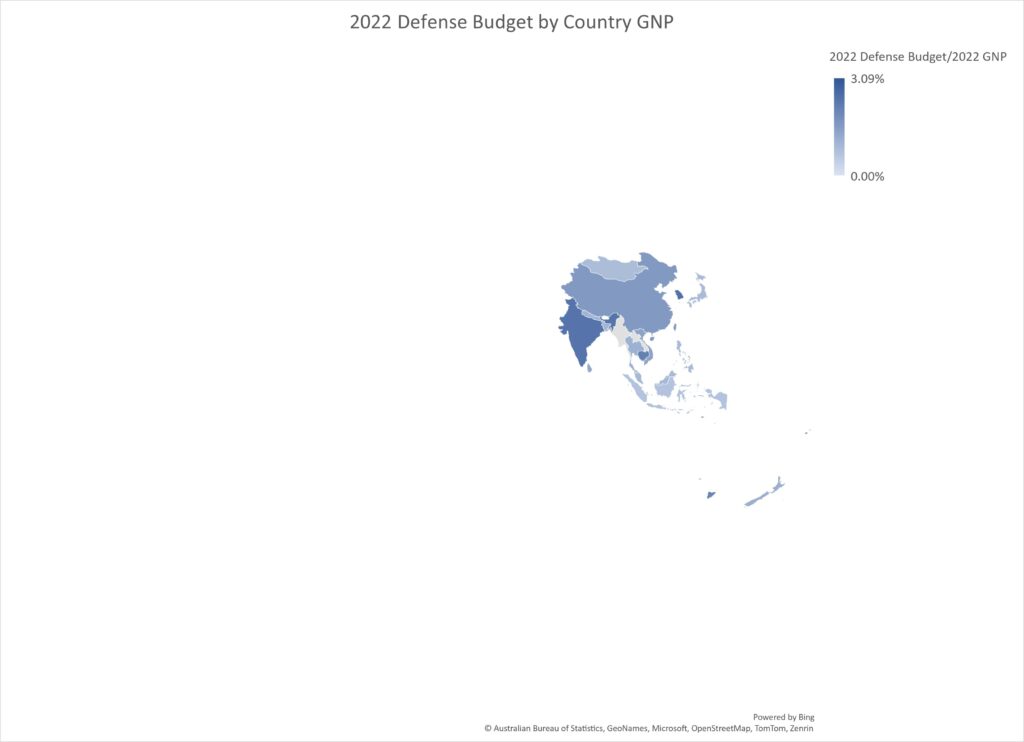
2022 Defense Budget as Percent of GNP by Country, Region
Top Decile
Bottom Decile
Ukraine
29.1%
Malta
(0.5)%
Azerbaijan
5.2%
Moldova
(0.3)%
Armenia
4.8%
Ireland
(0.3)%
Greece
3.5%
Iceland
0%
Top Decile
Bottom Decile
Singapore
3.1%
Philippines
(0.9)%
Brunei
3.1%
Japan
(0.9)%
South Korea
2.5%
Mongolia
(0.8)%
India
2.4%
Indonesia
(0.7)%
To view a copy of the Excel source file, complete with calculations and references, please download the file below: